


Humalog Insulin: Investigating the Potential Implications of Insulin Price Hikes on Company Financial Data
By S. Stark & J. Wood

Hi and welcome to the latest edition of Data for Insulin.
If you’re new, please 👇.
Hi, Hannah here. Today, I’m sharing a great paper from insulin advocates S. Stark and J. Wood showing the relationship of insulin price increases with key financial metrics from the insulin manufacturers, the focus being Humalog and Eli Lilly. I’m really excited and grateful that the paper authors chose to make this analysis accessible by publishing to my newsletter.
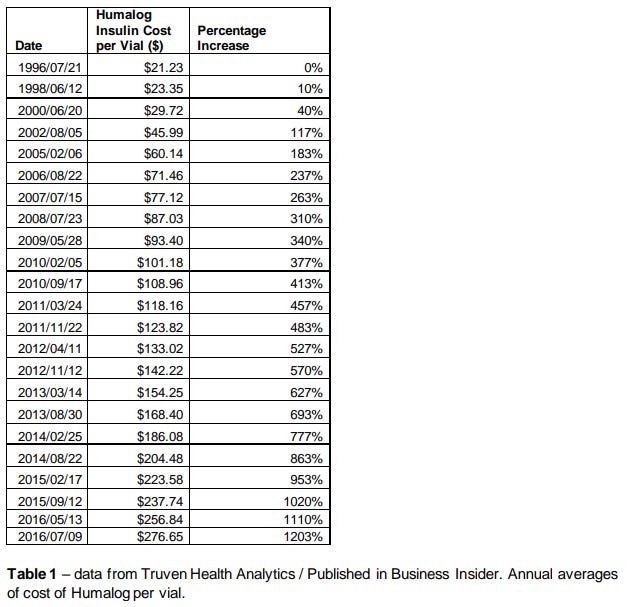
Make sure to check out Appendix B, where the authors were able to reverse engineer insulin list prices from published price increase graphs using the Truven Health Analytics data. This is now the best information we have on how insulin list prices have changed over time.
If you have a piece of data work you’d like published to this site, please get in touch.
Download the paper here.
Purpose
The price of insulin has garnered national attention and outrage by patients and advocates alike and continues to dominate conversations regarding healthcare access and affordability. Insulin manufacturers, like Eli Lilly and Company, continue to defend their price hikes in the face of insulin rationing deaths, citing the importance of reinvesting in Research & Development while pushing back on stakeholders within the industry such as insurance providers and Pharmaceutical Benefits Managers.
There has been an overwhelming lack of transparency in how companies, such as Eli Lilly, price drugs like insulin, and a subsequent lack of action by congress to stop the unexplained price hikes that are killing Americans. The purpose of this paper is to identify how Eli Lilly is spending their revenue in order to better understand the significant price increases in Humalog insulin.
Methodology
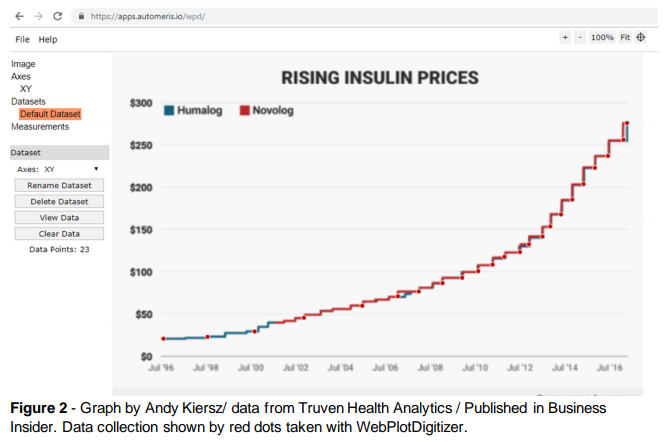
The insulin price information was gathered through a process of reverse engineering data points from a graph compiled by Andy Kiersz based on data from Truven Health Analytics and published in a Business Insider article written by Lydia Ramsey in May of 2017. Kiersz’s graph titled “Rising Insulin Prices” highlights the increase in the cost of Humalog and Novolog insulins from 1996 through 2016. This paper will specifically focus on Humalog insulin, introduced to the US market in 1996, and its manufacturer, Eli Lilly & Company. Data points were extracted for most years between 1996 through 2016 using WebPlotDigitizer v4.2.
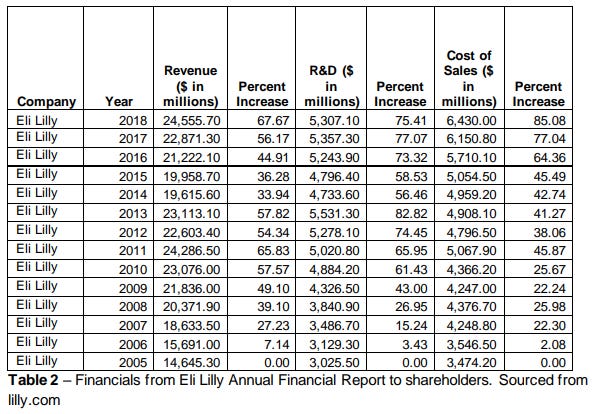
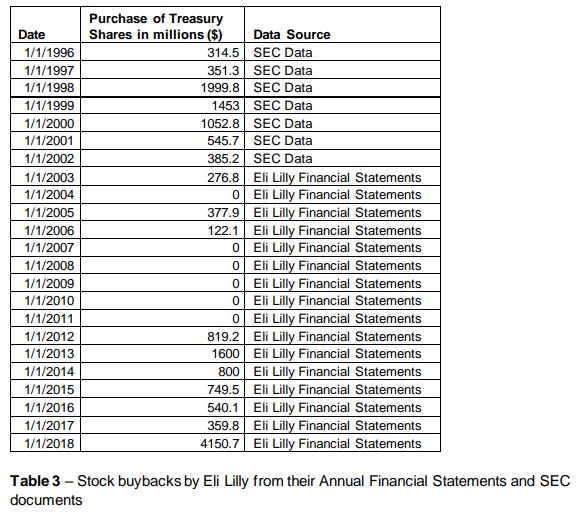
Company financial data for Eli Lilly, including Cost of Sale, investment in Research and Development (R&D), and purchase of Common Stock for the treasury, were gathered directly from the Eli Lilly and Company Annual Reports published from 2003 through 2018, as well as 10-K filings from the U.S. Securities and Exchange Commission (SEC) for data from 1996-2002.
The following formula was used to calculate the percentage change over time for the price of Humalog insulin and adapted to account for the percentage changes in Eli Lilly’s expenditures on Cost of Sales as well as R&D:
(current insulin price - start year insulin price) / start year insulin price x 100
Findings
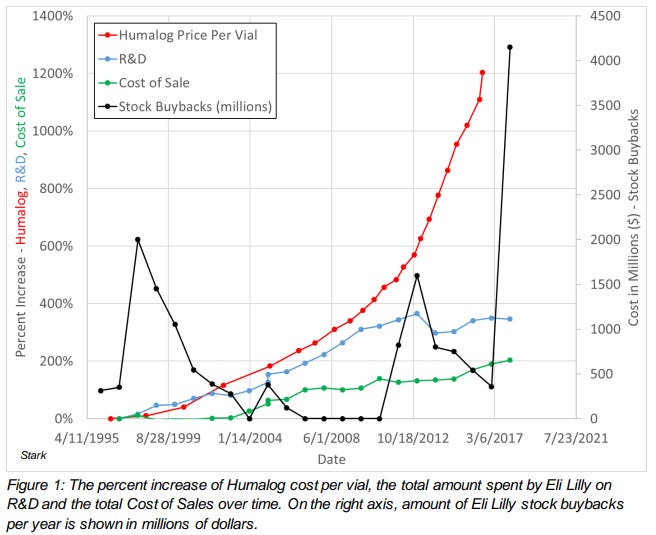
After plotting the percentage increases in the price of Humalog over two decades, we found that while the cost per vial of insulin has been steadily rising since 1996, there was a sudden and dramatic increase in the rate of which prices went up beginning in 2011. From 1996 to 2016 the price of Humalog increased 1,203% per vial.
We then plotted the percentage increase in Eli Lilly’s spending on R&D and Cost of Sales from 1996 through 2016 and found that while spending increased 346% and 203%, respectively, it did not account for or explain the 1200% increase in the cost of Humalog during that same time period.
These results prompted us to dig deeper and examine data from Eli Lilly and Company’s Annual Financial Statement to Shareholders and 10-K filings from the SEC. In doing so, we noticed several key takeaways. We see that in the year 1998, two years after Humalog hit the market, there was a sudden rise in the amount of Common Stock purchased by Eli Lilly for their treasury (also known as stock buybacks). Stock buybacks then began to rapidly decrease, noticeably during the same time frame (2000) that Novolog was introduced to the market. There were no other significant trends or changes in the number of Common Stock purchased for treasury until 2011, when we simultaneously see the sharp increase in the price of Humalog insulin.
While our results did indicate Eli Lilly experienced an increase in Cost of Sales and investment in R&D during the same time period Humalog insulin increased in price, there were significant disparities in percentage increases. However, there was a clear correlation between the sharp increase in the price of Humalog insulin and the amount of stocks repurchased from shareholders during that same time period.
Limitations & Implications for Future Work
The insulin price data was gathered from Kiersz’s graph using a website-based application, ultimately leaving room for a margin of error. In addition, insulin and other drugs can vary in price from pharmacy to pharmacy consequently contributing to this margin.
Further, the percentage increases compared in this dataset use price data from one particular drug, Humalog insulin, and compare it to the overall Cost of Sales and investment in R&D for Eli Lilly and Company as a whole. According to Eli Lilly, they are responsible for manufacturing more than 43 drugs. In the future, it would be helpful to identify revenue specific to Humalog insulin in order to better understand the proportion of Cost of Sales and R&D it is directly responsible for.
Appendix
Appendix A: Humalog Insulin Cost per Vial WebPlotDigitizer Data Extraction Plot
Appendix B: Humalog Insulin Cost per Vial Data Table
Appendix C: Eli Lilly Financial Report
Appendix D: Eli Lilly Purchase of Treasury Stock
References
Eli Lilly and Company. (1999). Form 10-K 1998.
Eli Lilly and Company. (2002). Form 10-K 1998.
Eli Lilly and Company. (2005). Form 10-K 1998.